MAUI REAL ESTATE STATISTICS: Jan-Sept 2017 vs. Jan-Sept 2016

THE CONDO AND HOME MARKETS | Key Metrics
| KEY METRICS | New Listings | Pending | Sold | DOM | Med SP | Avg SP |
| Homes | +10% | +14% | +3% | -10% | +10% | +8% |
| Condos | -4% | +15% | +7% | -6% | +8% | +7% |
Comparing key metrics through September 2017 Year Over Year with 2016:
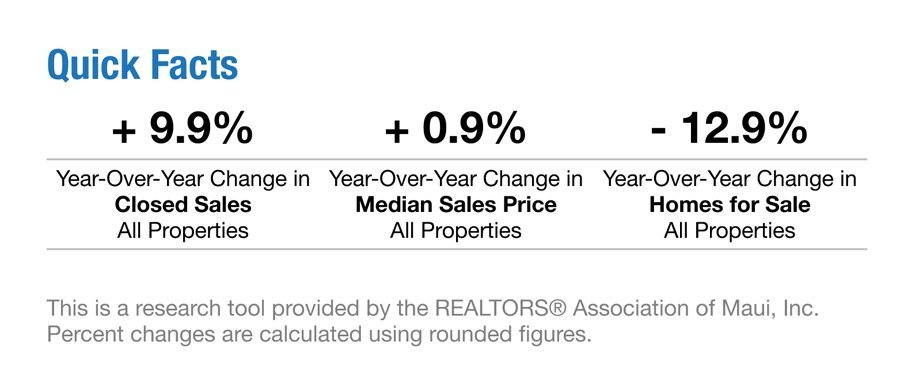
While there are more new home listings, there were fewer new condo listings through Sept. 2017. Other key indicators show increases in Pending Sales, Number of Sales, Median Sales Prices, and Average Sales Prices, while Days on Market till closing is down. Our busy season begins in Mid Nov, tends to quiet down first two weeks of December, and then remains active
…

