
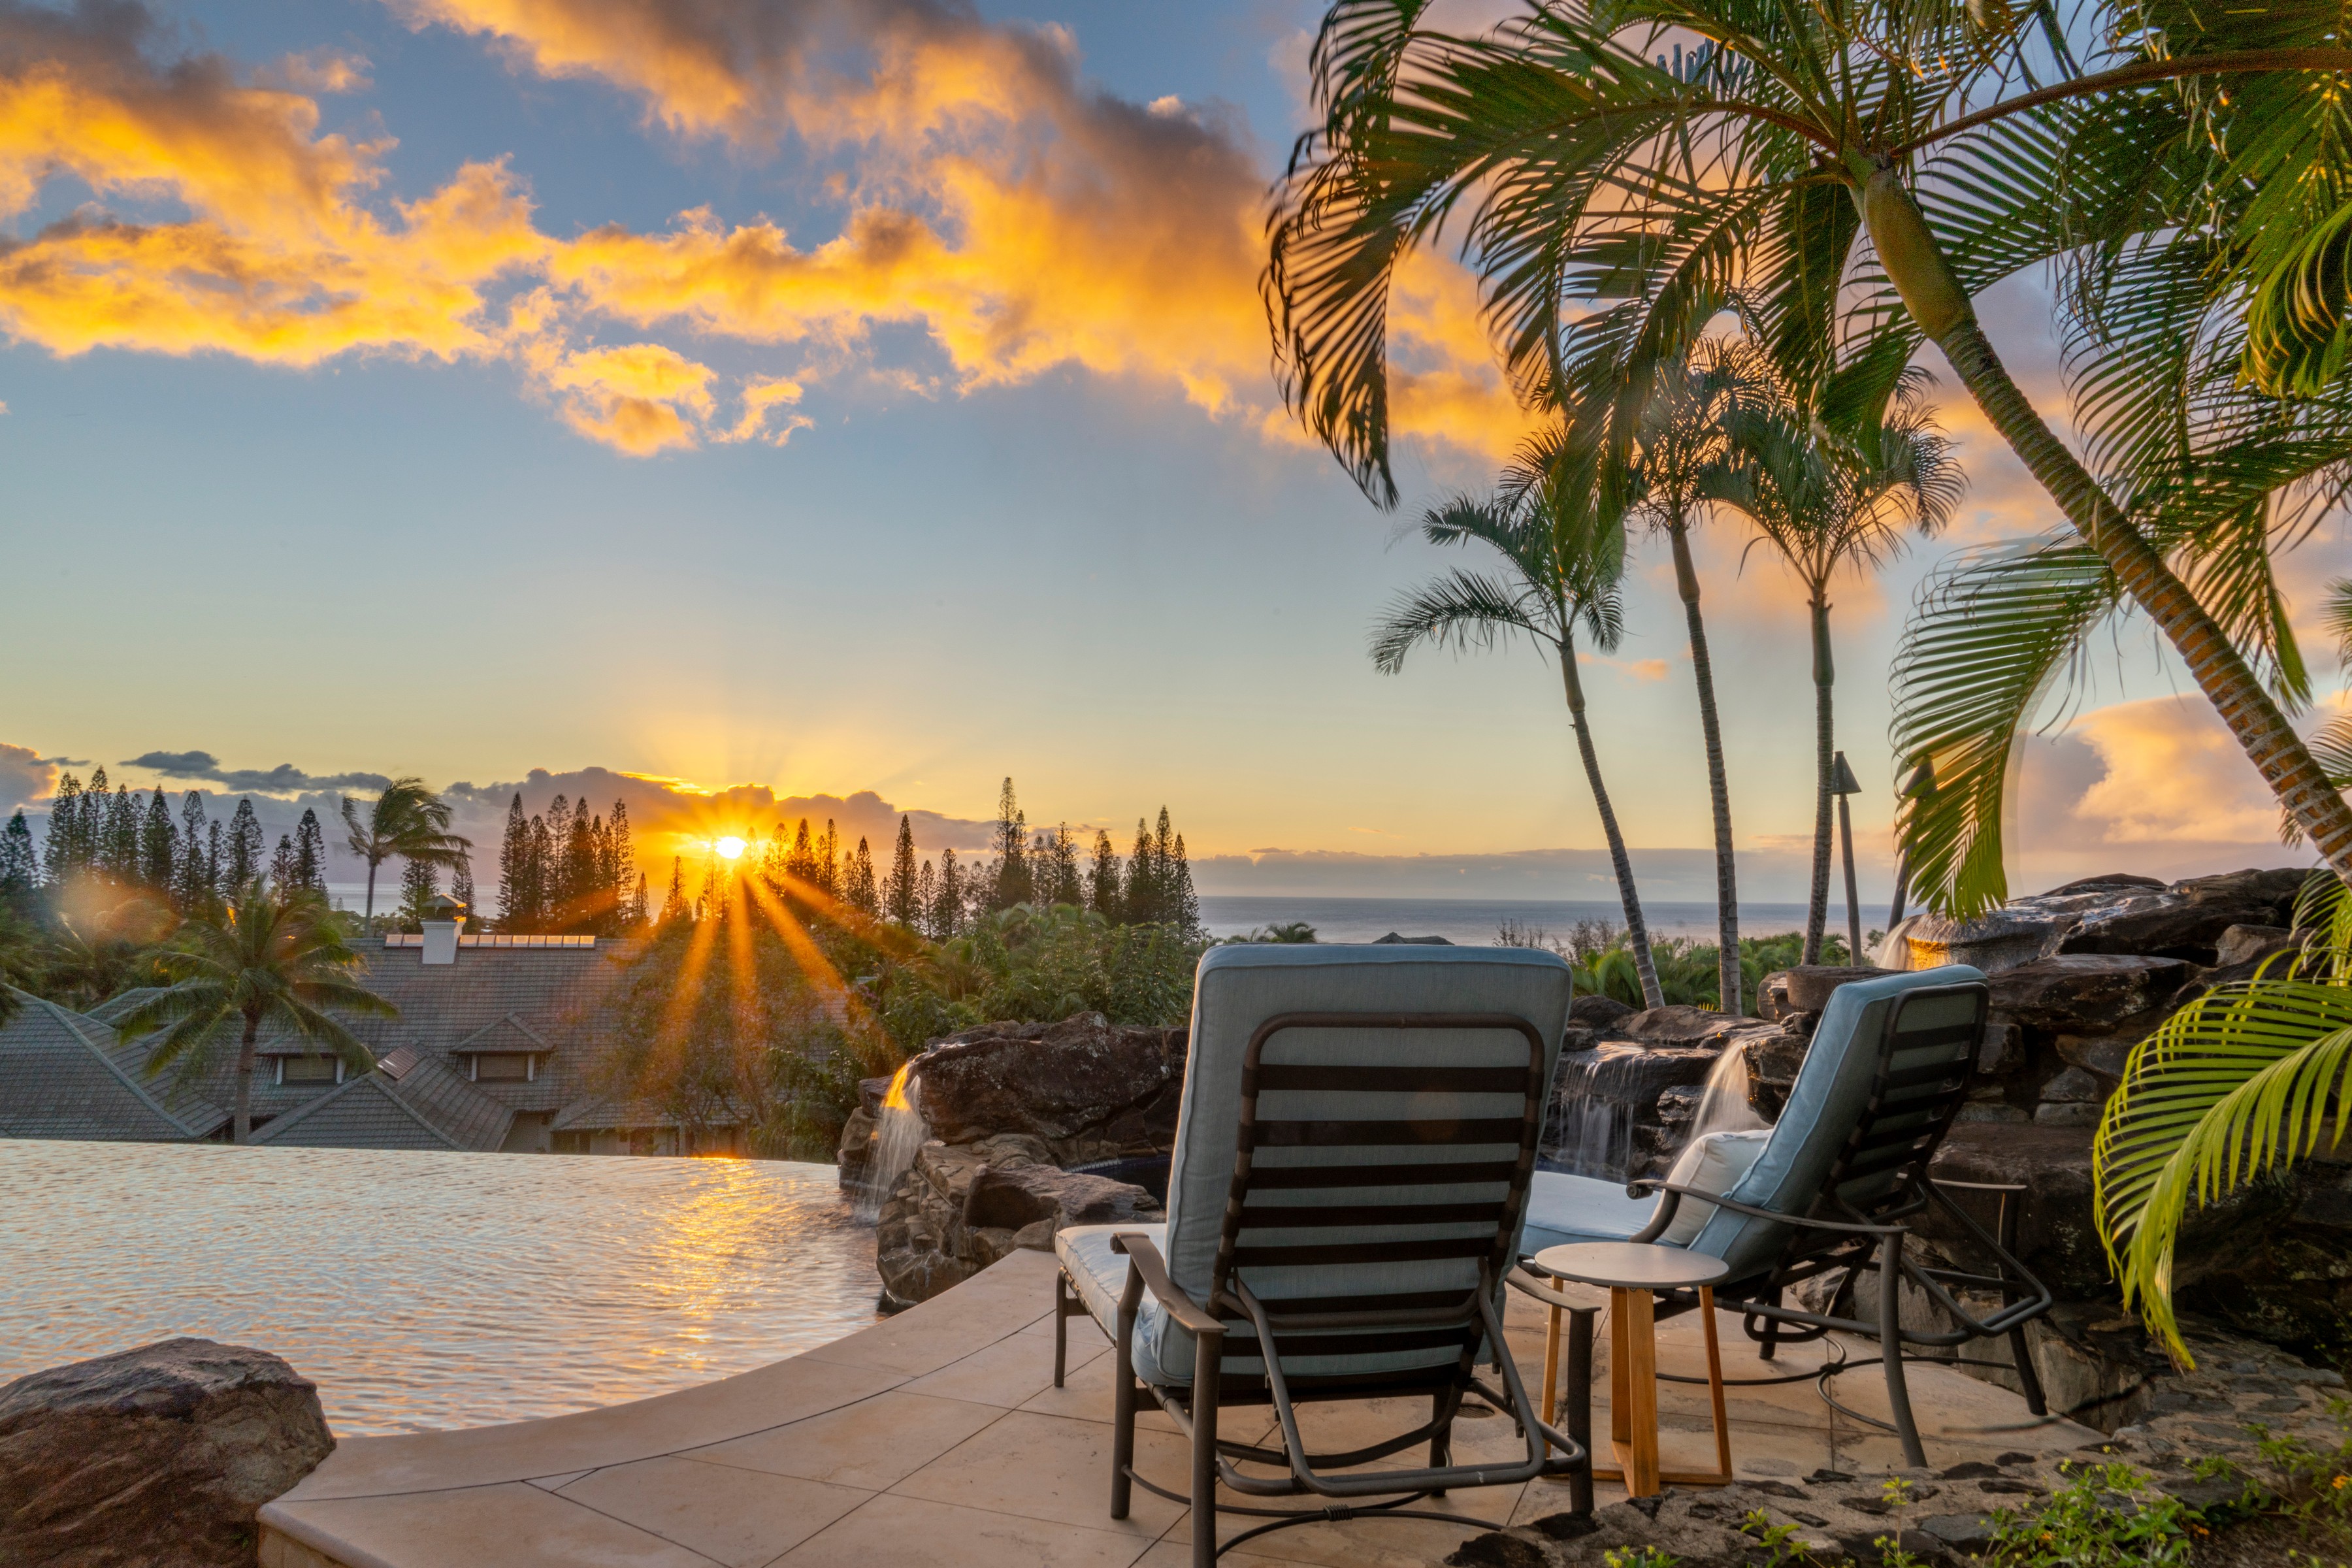
The view from 1008 Sunset, Pineapple Hill, Kapalua
Three quarters into 2026, Maui’s single-family home market is showing a clear shift in where buyers are most active. South Maui sales grew by more than 25%, West Maui held relatively steady, and in both regions the mix moved toward homes under $3 million while sale prices stayed close to asking.
This report compares closed home sales in West and South Maui through Q3 of 2026 with the same period in 2025. It highlights selected Resort & Second Home Communities in each region: Kapalua Resort, Kāʻanapali Resort, and Launiupoko in West Maui, and Wailea/Mākena in South Maui.
Each section includes absorption rates by bedroom count and price range, based on active inventory as of October 8, 2026.
West Maui vs. South Maui: How the Residential Markets Compare
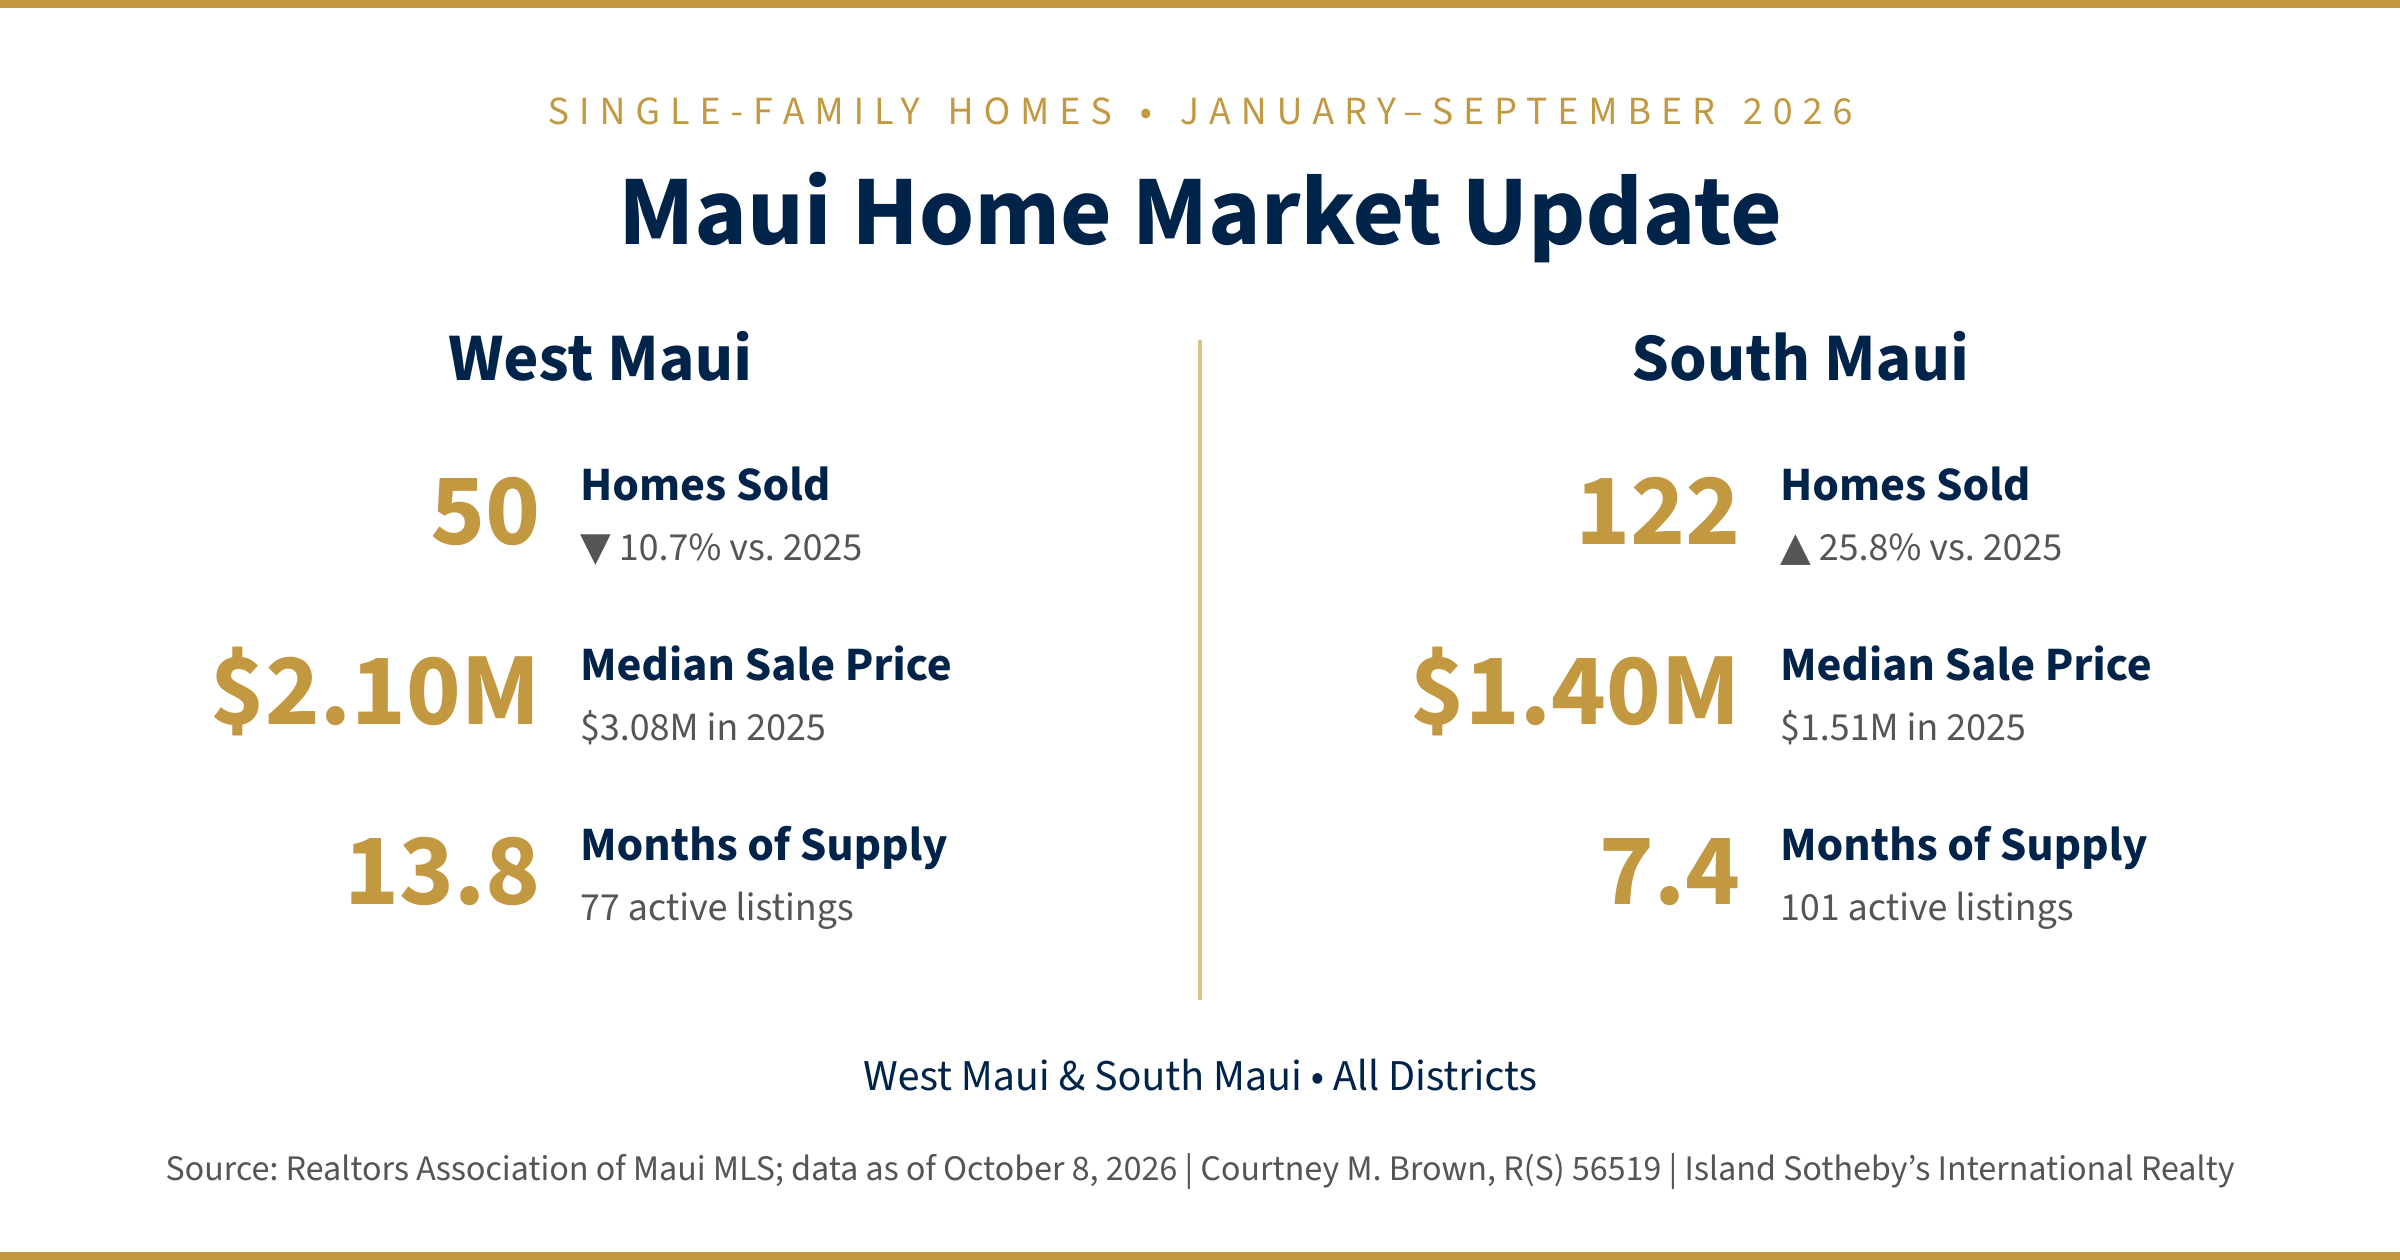
South Maui was the more active home market through the first three quarters of 2026. It recorded 122 sales, up 25.8%, while West Maui recorded 50, down 10.7%. South Maui also offers a more accessible entry point in Kihei, with a median sale price of $1,400,000 compared with $2,097,500 in West Maui, and tighter supply at 7.4 months versus 13.8 months. Homes in both regions continue to sell close to asking, at 94.9% of list price in South Maui and 93.8% in West Maui.
Both regions share a common theme: buyers are most active below $3 million, while estate-level homes above $5 million offer buyers a broad selection (24.0 months of supply in West Maui and 32.0 months in South Maui). Lower medians in both regions reflect fewer estate sales compared with 2025, rather than a broad decline in value
West Maui Homes at a Glance
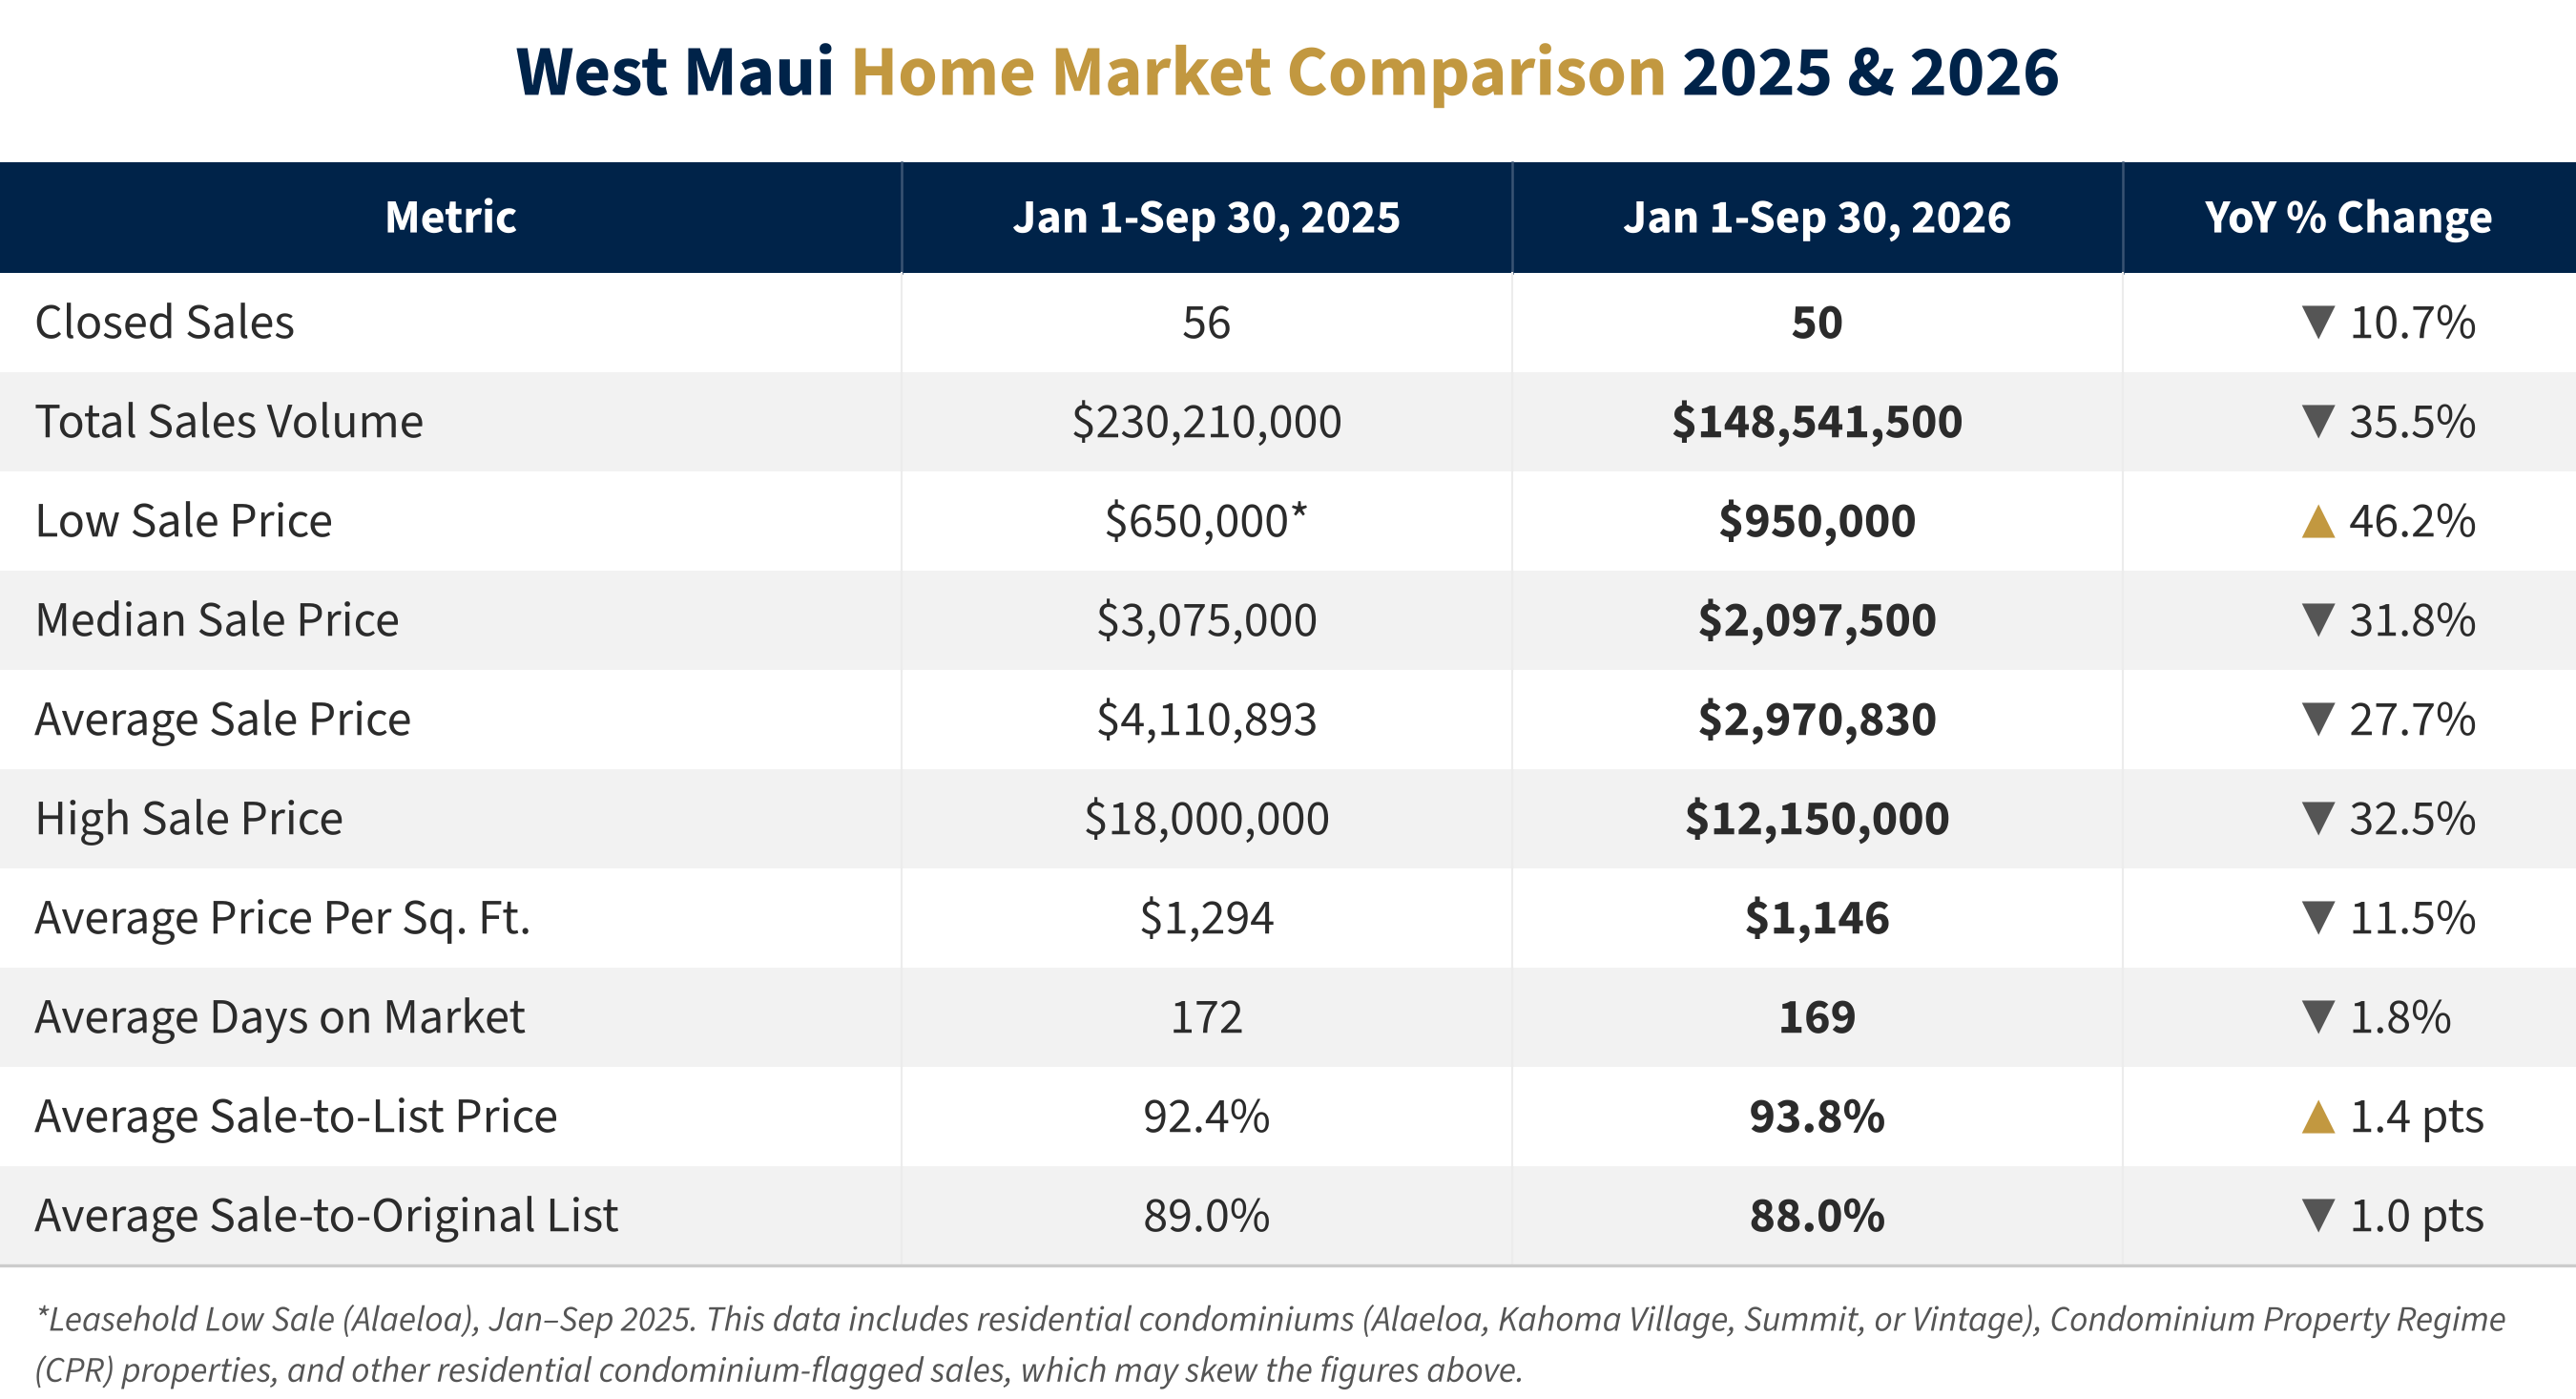
West Maui recorded 50 home sales through the first three quarters of 2026, compared with 56 in the same period of 2025. While the number of sales fell 10.7%, the total sales volume declined 35.5% to $148.5 million, and the median sale price dropped 31.8%.
The primary driver is a shift in mix rather than a broad repricing: sales above $3 million eased from 28 to 17, while sales between $1 million and $3 million rose from 25 to 30. The Lahaina district accounted for 17 sales in 2026, up from 11, while Kapalua and Kāʻanapali together moved down from 23 to 15.
Homes sold at an average of 93.8% of final list price, up from 92.4%, and average days on market held essentially steady at 169 days. Average price per square foot eased 11.5% to $1,146, again reflecting a greater share of sales in the more accessible price bands.
For buyers, this means expanded opportunity in the $1–3 million range; for sellers, well-priced homes continue to close near their list price.
How Is the West Maui Home Market Moving? What Is the Absorption Rate?
With 77 active listings and 67 closed sales over the past 12 months, West Maui currently carries 13.8 months of supply. The fastest-moving segments are homes under $1 million (4.0 months) and the $2–3 million range (6.4 months), along with 2-bedroom homes (7.5 months). Inventory is deepest above $4 million, where both the $4–5 million and $5 million-plus bands sit at 24.0 months, and among 4-bedroom homes at 18.0 months.
Kapalua Resort Homes
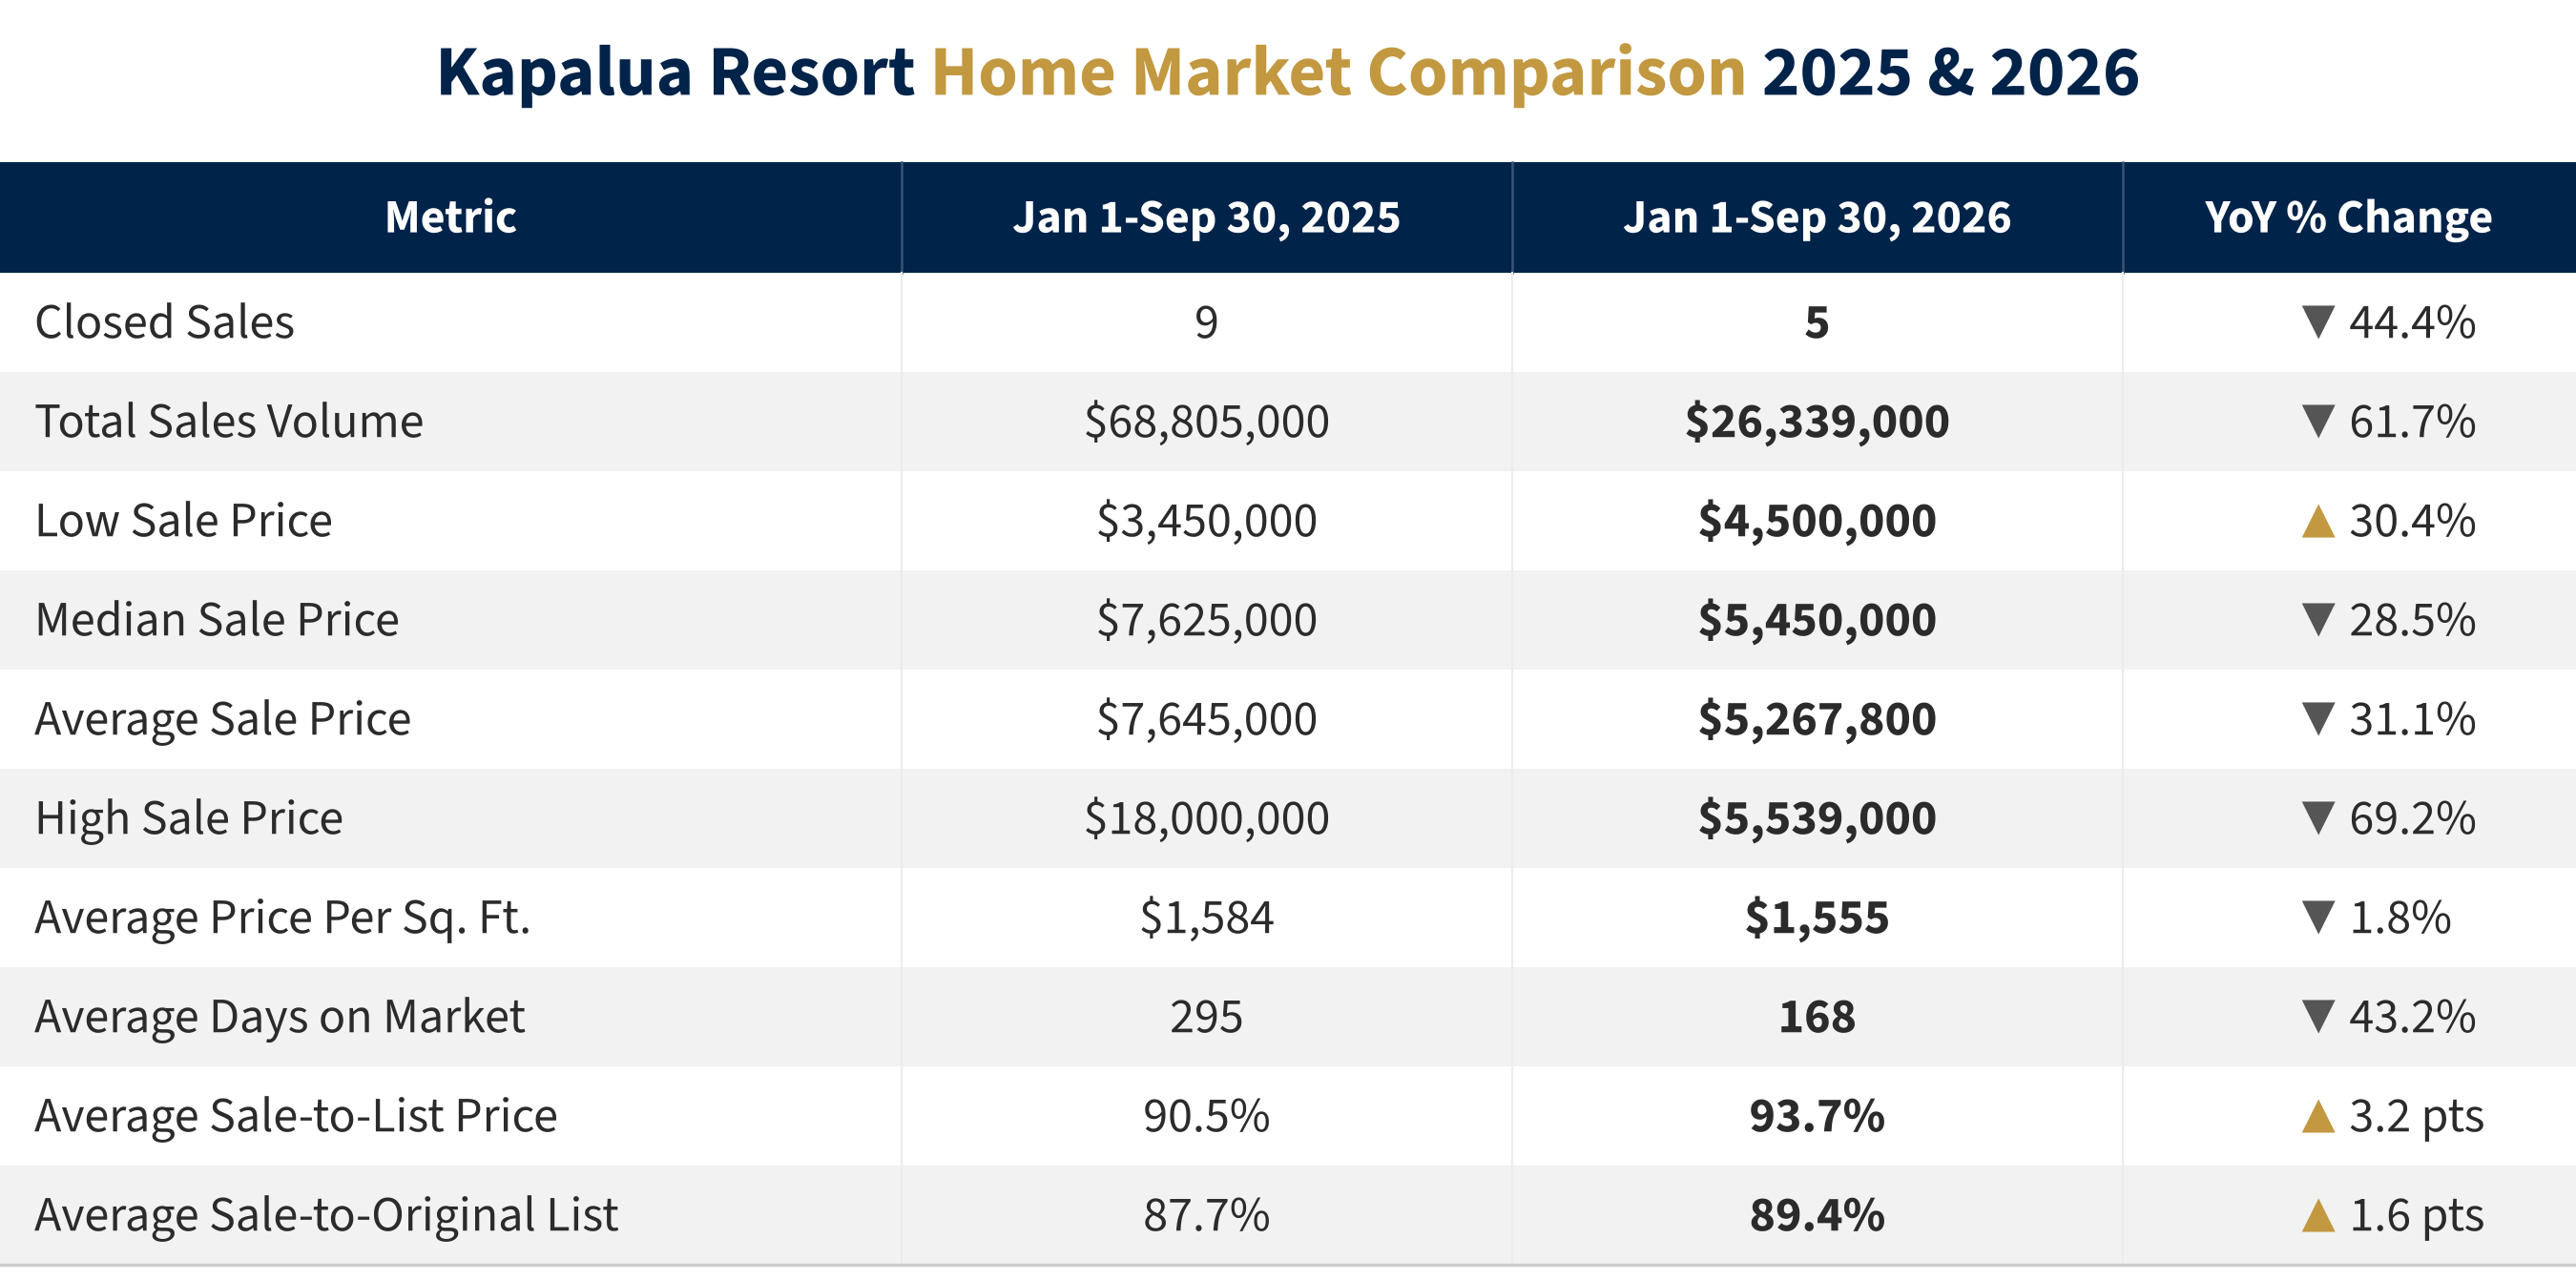
Kapalua Resort recorded 5 home sales through Q3 2026, compared with 9 in 2025. Total volume moved from $68.8 million to $26.3 million, and the median sale price from $7,625,000 to $5,450,000. The 2025 period included an $18,000,000 Plantation Estates sale and three new-construction Mahana Estates closings between $7.6 and $8.5 million, which lifted last year's figures. In 2026, every sale fell between $4.5 and $5.54 million, in Pineapple Hill and Mahana Estates.
Value per square foot held firm at $1,555, within 1.8% of last year's $1,584, a sign that underlying pricing is stable even as the mix shifted. Homes also sold faster and closer to asking: average days on market fell 43.2% to 168 days, and the average sale-to-list ratio improved to 93.7% from 90.5%.
With such a small data sample of closings in 2026, these figures are best read as directional.
Where Is the Kapalua Home Market Now? What Is the Absorption Rate?
Kapalua Resort has 14 active home listings against 7 sales over the past 12 months, or 24.0 months of supply. Activity is strongest among 3-bedroom homes (9.6 months) and in the $3–4 million range (6.0 months), while 4-bedroom homes (36.0 months) and the $5 million-plus segment (30.0 months) offer buyers the widest selection. Given the small sample, these rates can shift meaningfully with a single sale.
Explore Kapalua Resort homes for sale →
Kāʻanapali Homes
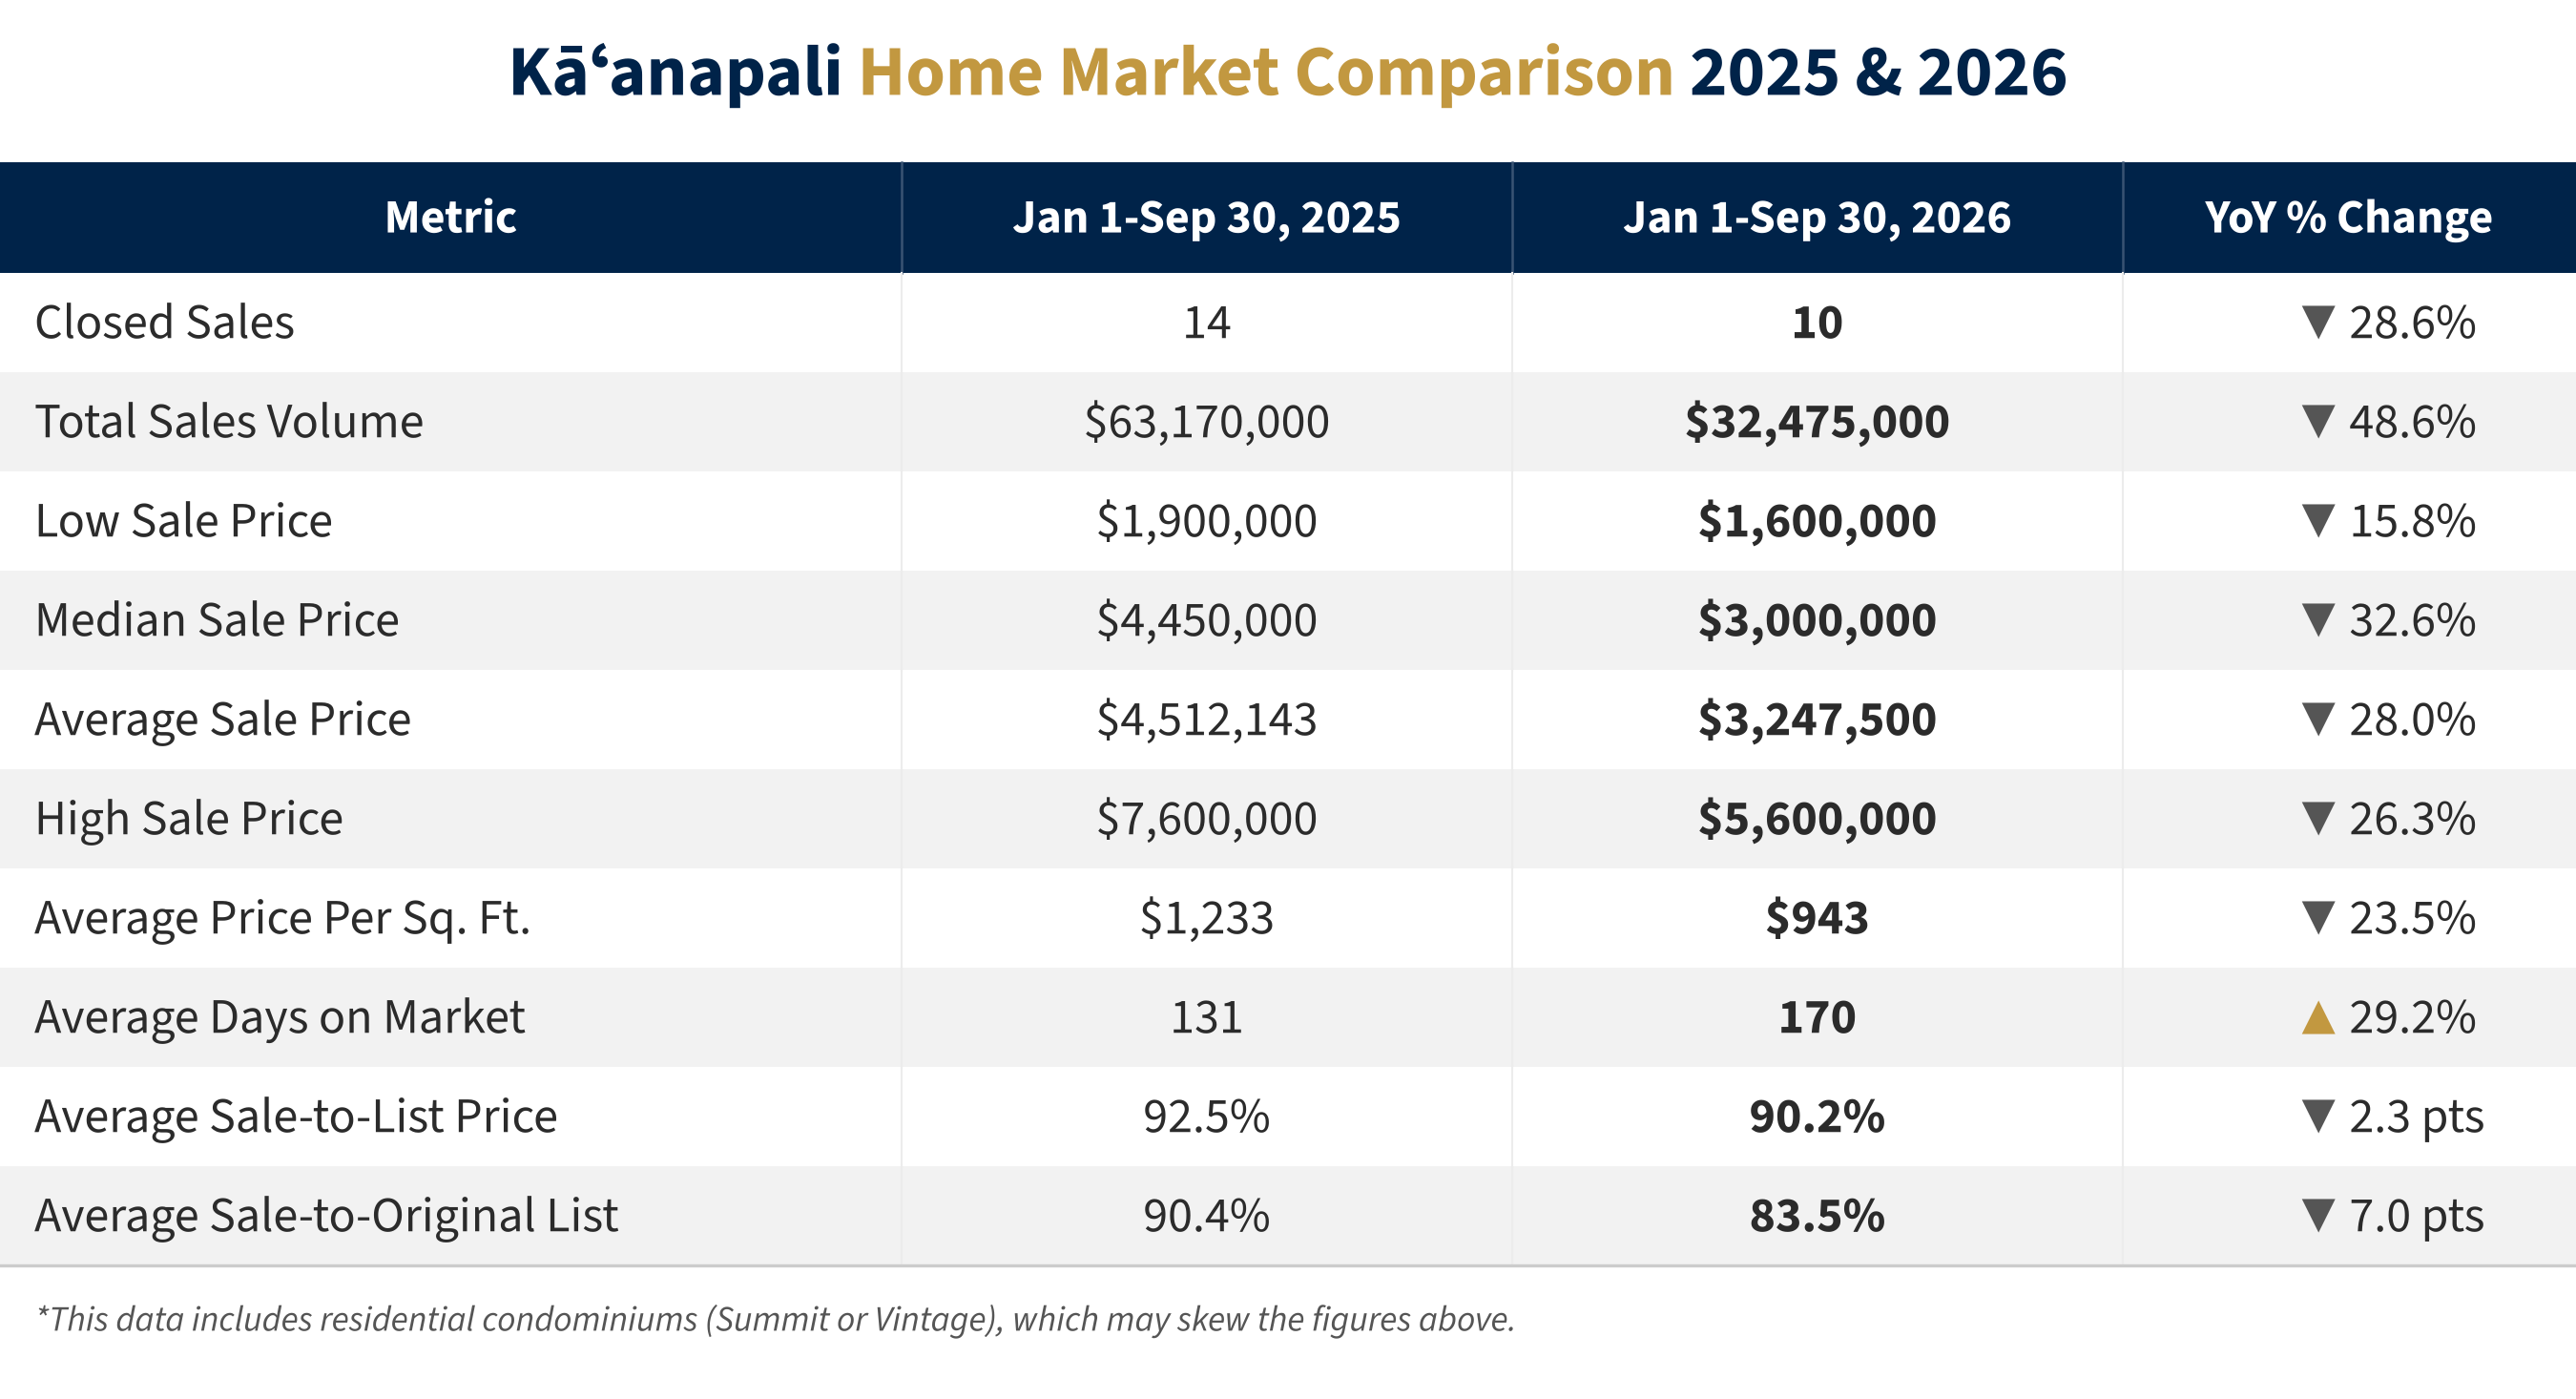
Kāʻanapali closed 10 home sales through Q3 2026, compared with 14 in 2025. The median sale price moved from $4,450,000 to $3,000,000, and total volume from $63.2 million to $32.5 million. Much of this reflects where buyers transacted: seven of the ten 2026 sales were between $1.6 and $3.3 million, centered on Kāʻanapali Hillside and nearby neighborhoods, while nine of the fourteen 2025 sales were at $4 million or above in the resort's higher end communities such as Lanikeha, Kāʻanapali Golf Estates, and Kāʻanapali Coffee Farms.
Negotiation is playing a larger role in this segment. Average days on market rose to 170 from 131, the average sale-to-list ratio eased to 90.2% from 92.5%, and the average sale-to-original-list ratio moved to 83.5% from 90.4%, indicating that price adjustments during marketing were more common in 2026.
For buyers, this creates room for thoughtful negotiation; for sellers, accurate pricing from the first day on market is the clearest path to a strong result.
Where Is the Kāʻanapali Home Market Now? What Is the Absorption Rate?
Kāʻanapali has the tightest supply of the areas in this report at 9.8 months, with 13 active listings and 3 pending against 16 sales over the past 12 months. 5-bedroom homes (4.0 months) and 4-bedroom homes (7.5 months) are moving fastest, as are the $3–4 million (6.0 months) and $2–3 million (6.9 months) price bands. No homes are currently listed between $1 and $2 million, while the $5 million-plus segment holds 15.0 months of supply and 6-bedroom homes 24.0 months.
Explore Kāʻanapali homes for sale →
Launiupoko Homes
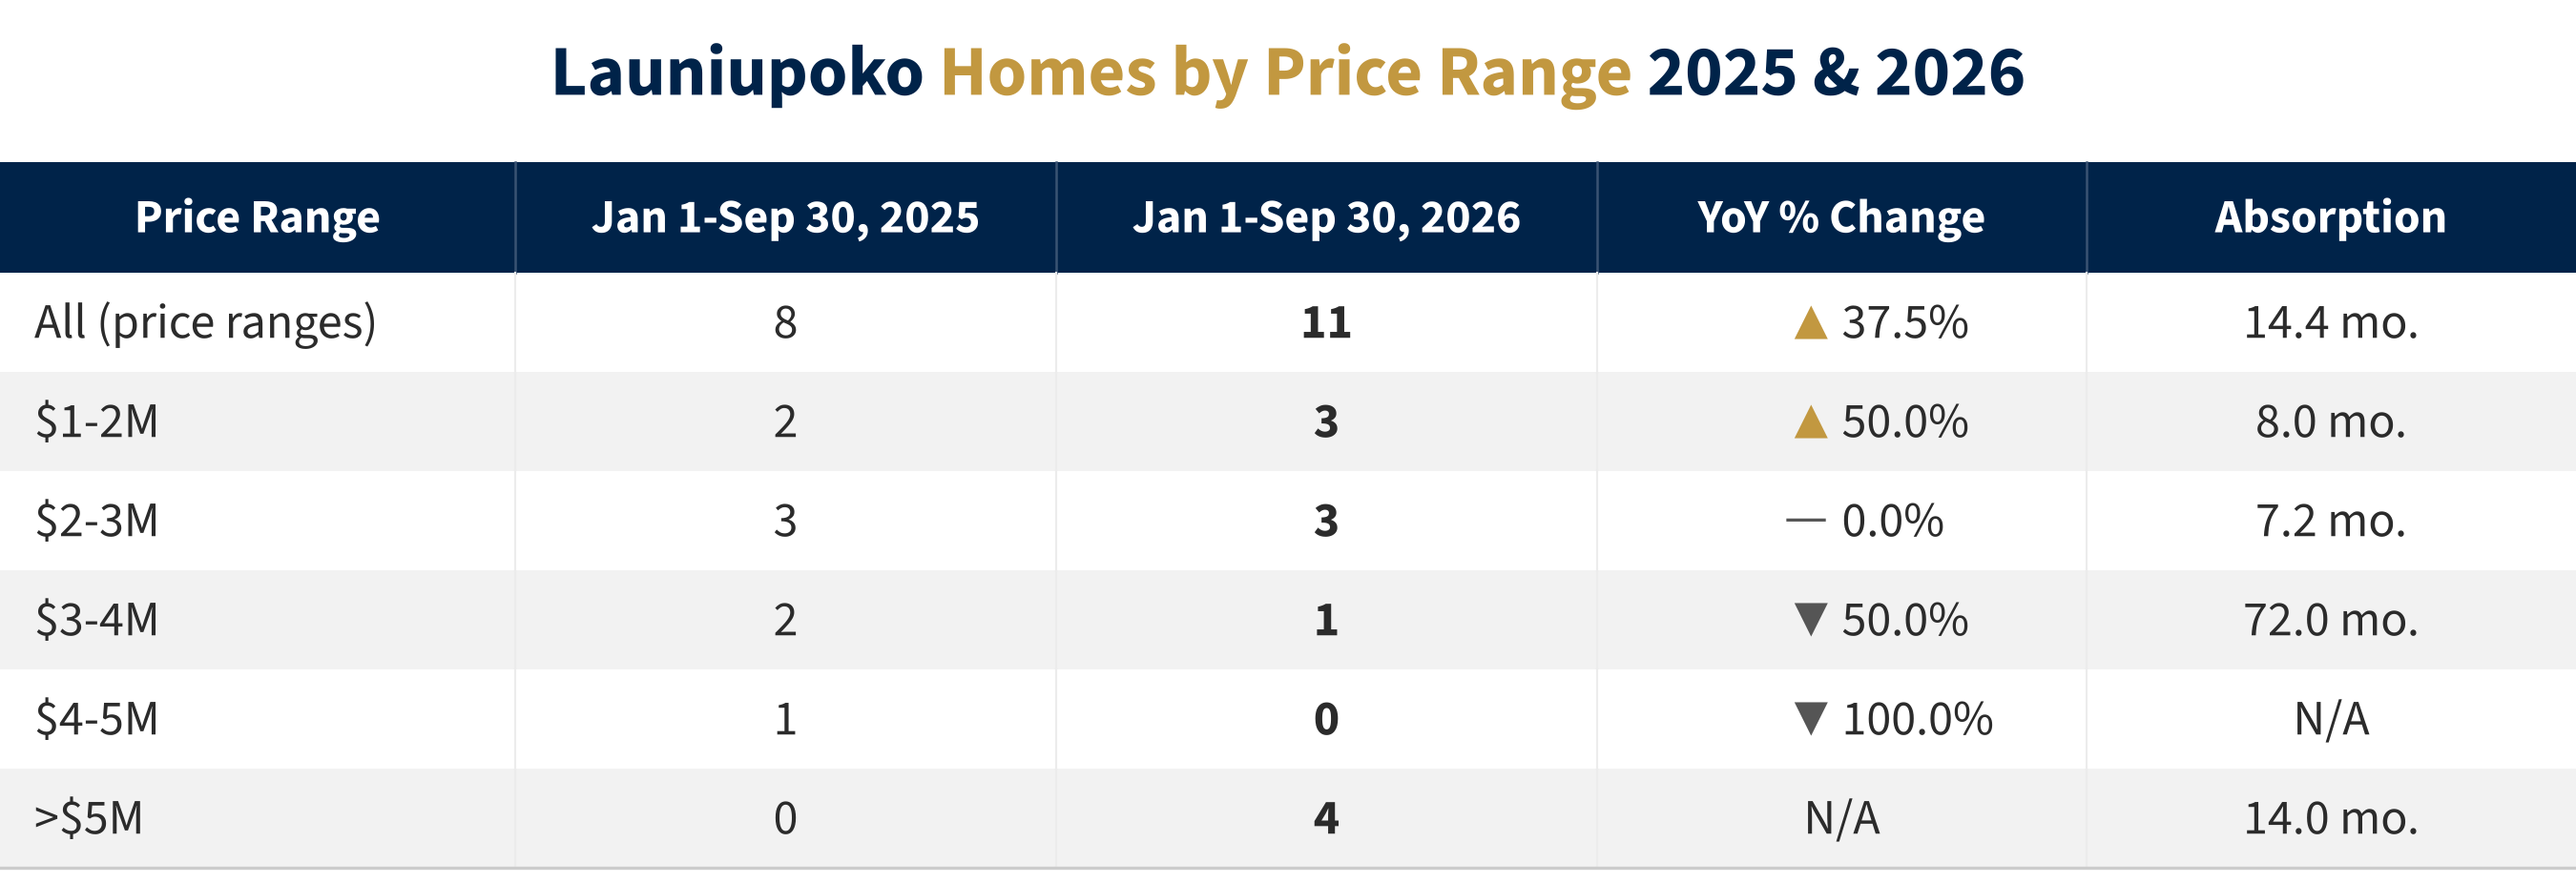
Launiupoko was the standout performer, with home sales rising 37.5% from 8 to 11 and total volume more than doubling (up 101.5%) to $47.0 million. The median sale price held steady at $2,950,000 (up 1.3%), while the average rose 46.5% to $4,270,364, led by a $12,150,000 Mākila Plantation estate and three additional closings above $5 million, a price band with no sales in the 2025 period.
Pricing strengthened across several measures: average price per square foot rose 15.1% to $1,834, and the average sale-to-list ratio improved to 93.1% from 90.2%. Launiupoko sale prices can vary significantly even at similar acreage.
Many parcels are structured as a Condominium Property Regime (CPR), where a Main Home unit, an ʻOhana unit, and sometimes an agricultural unit share one lot, and a sale may include the full property or a single unit. Individual comparisons should account for this structure.
Where Is the Launiupoko Home Market Now? What Is the Absorption Rate?
Launiupoko carries 14.4 months of supply, with 18 active listings and 15 sales over the past 12 months. The $2–3 million range (7.2 months) and $1–2 million range (8.0 months) are the most active, along with 2- and 4-bedroom homes (8.0 months each). Inventory is deepest in the $3–4 million band, where 6 active listings compare with a single sale in the past year (72.0 months), and among 3-bedroom homes (30.0 months).
Launiupoko pricing reflects a mix of full-property and single-unit CPR sales; individual comparisons should account for lot structure.
Explore Launiupoko homes for sale →
South Maui Homes at a Glance
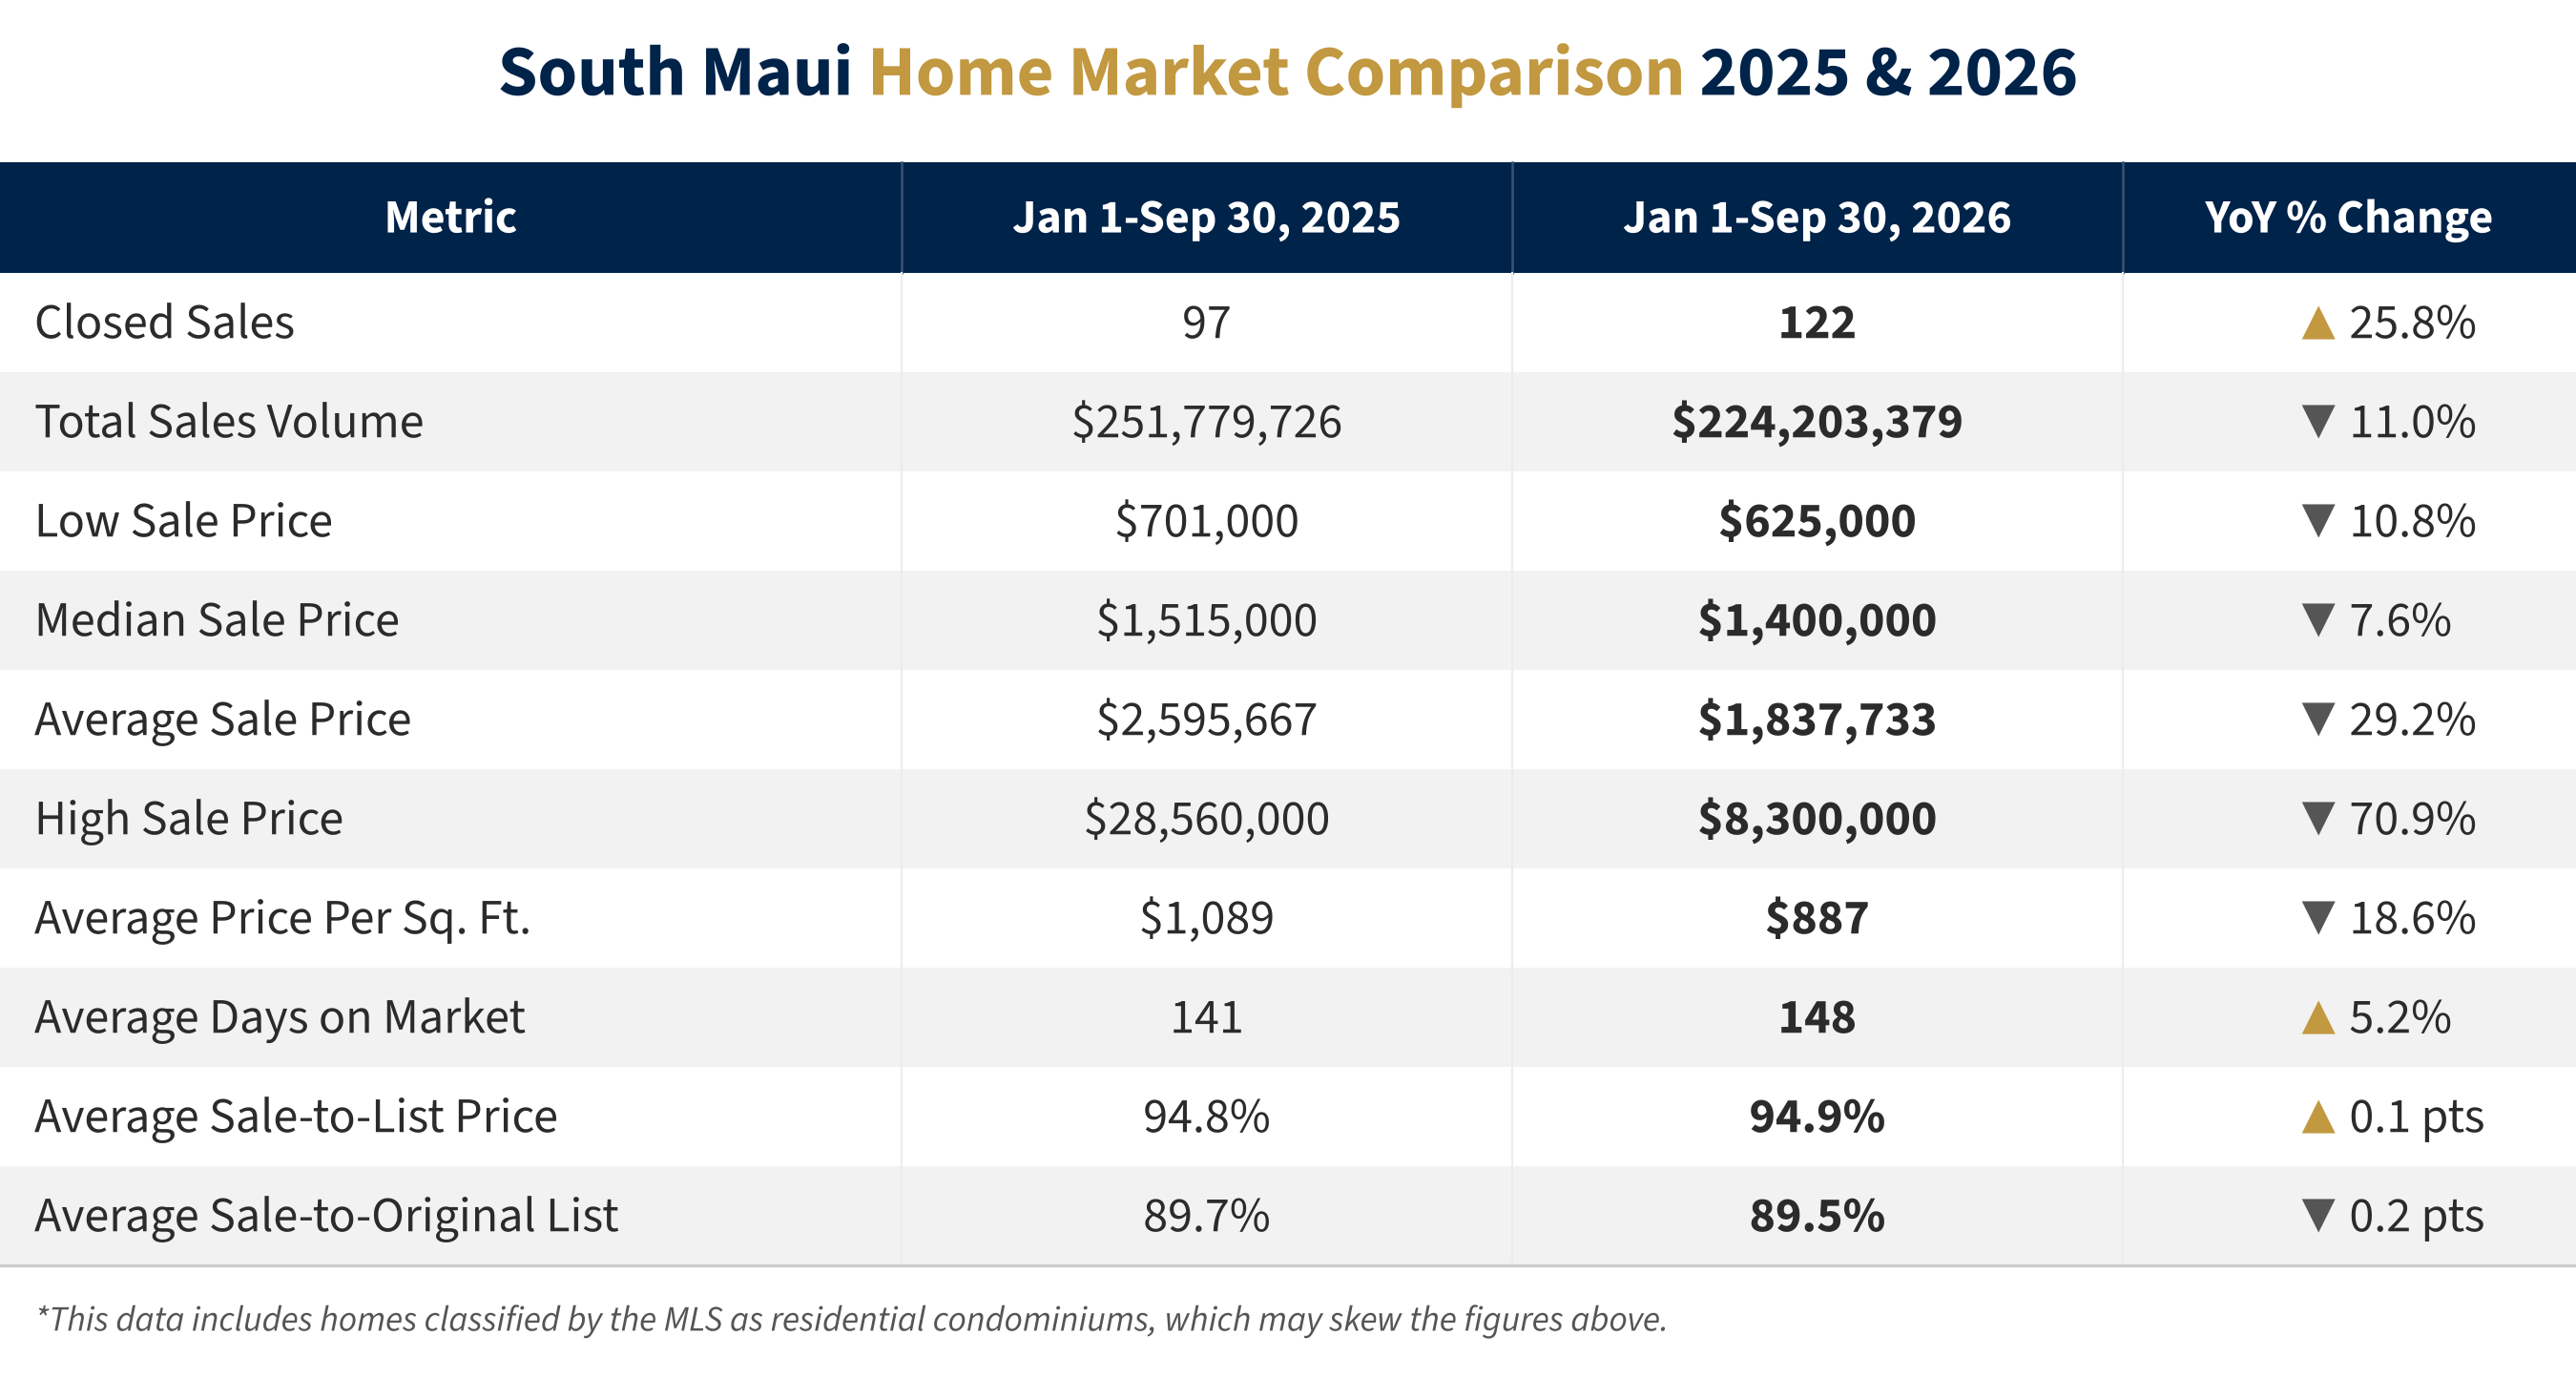
South Maui recorded 122 home sales through Q3 2026, up 25.8% from 97 in the same period of 2025. Total sales volume eased 11.0% to $224.2 million because the 2025 period included three oceanfront estate sales above $14 million: a $28,560,000 Keawakapu Beach home, a $17,250,000 Mākena Road estate and a $14,470,000 One Palauea Bay residence. The highest 2026 sale was $8,300,000 at The Ridge at Wailea. The median sale price moved from $1,515,000 to $1,400,000, and growth came from the more accessible price bands: sales under $1 million rose from 12 to 20, and sales between $1 million and $2 million from 53 to 70.
Pricing remains steady. Homes sold at an average of 94.9% of list price (94.8% in 2025), and average days on market held near 148 days. Average price per square foot moved to $887 from $1,089, reflecting fewer oceanfront sales rather than broad repricing. Maui Meadows recorded 13 sales in each period, with its median rising from $2,175,000 to $2,360,000.
How Is the South Maui Home Market Moving? What Is the Absorption Rate?
South Maui carries 7.4 months of supply, with 101 active listings and 21 pending against 163 sales over the past 12 months. Homes under $1 million (3.4 months) and between $1 million and $2 million (5.6 months) are moving fastest, along with 3-bedroom homes (6.0 months) and 2-bedroom homes (6.5 months). Inventory is deepest in the $4–5 million (36.0 months) and $5 million-plus (32.0 months) segments.
Kīhei Homes
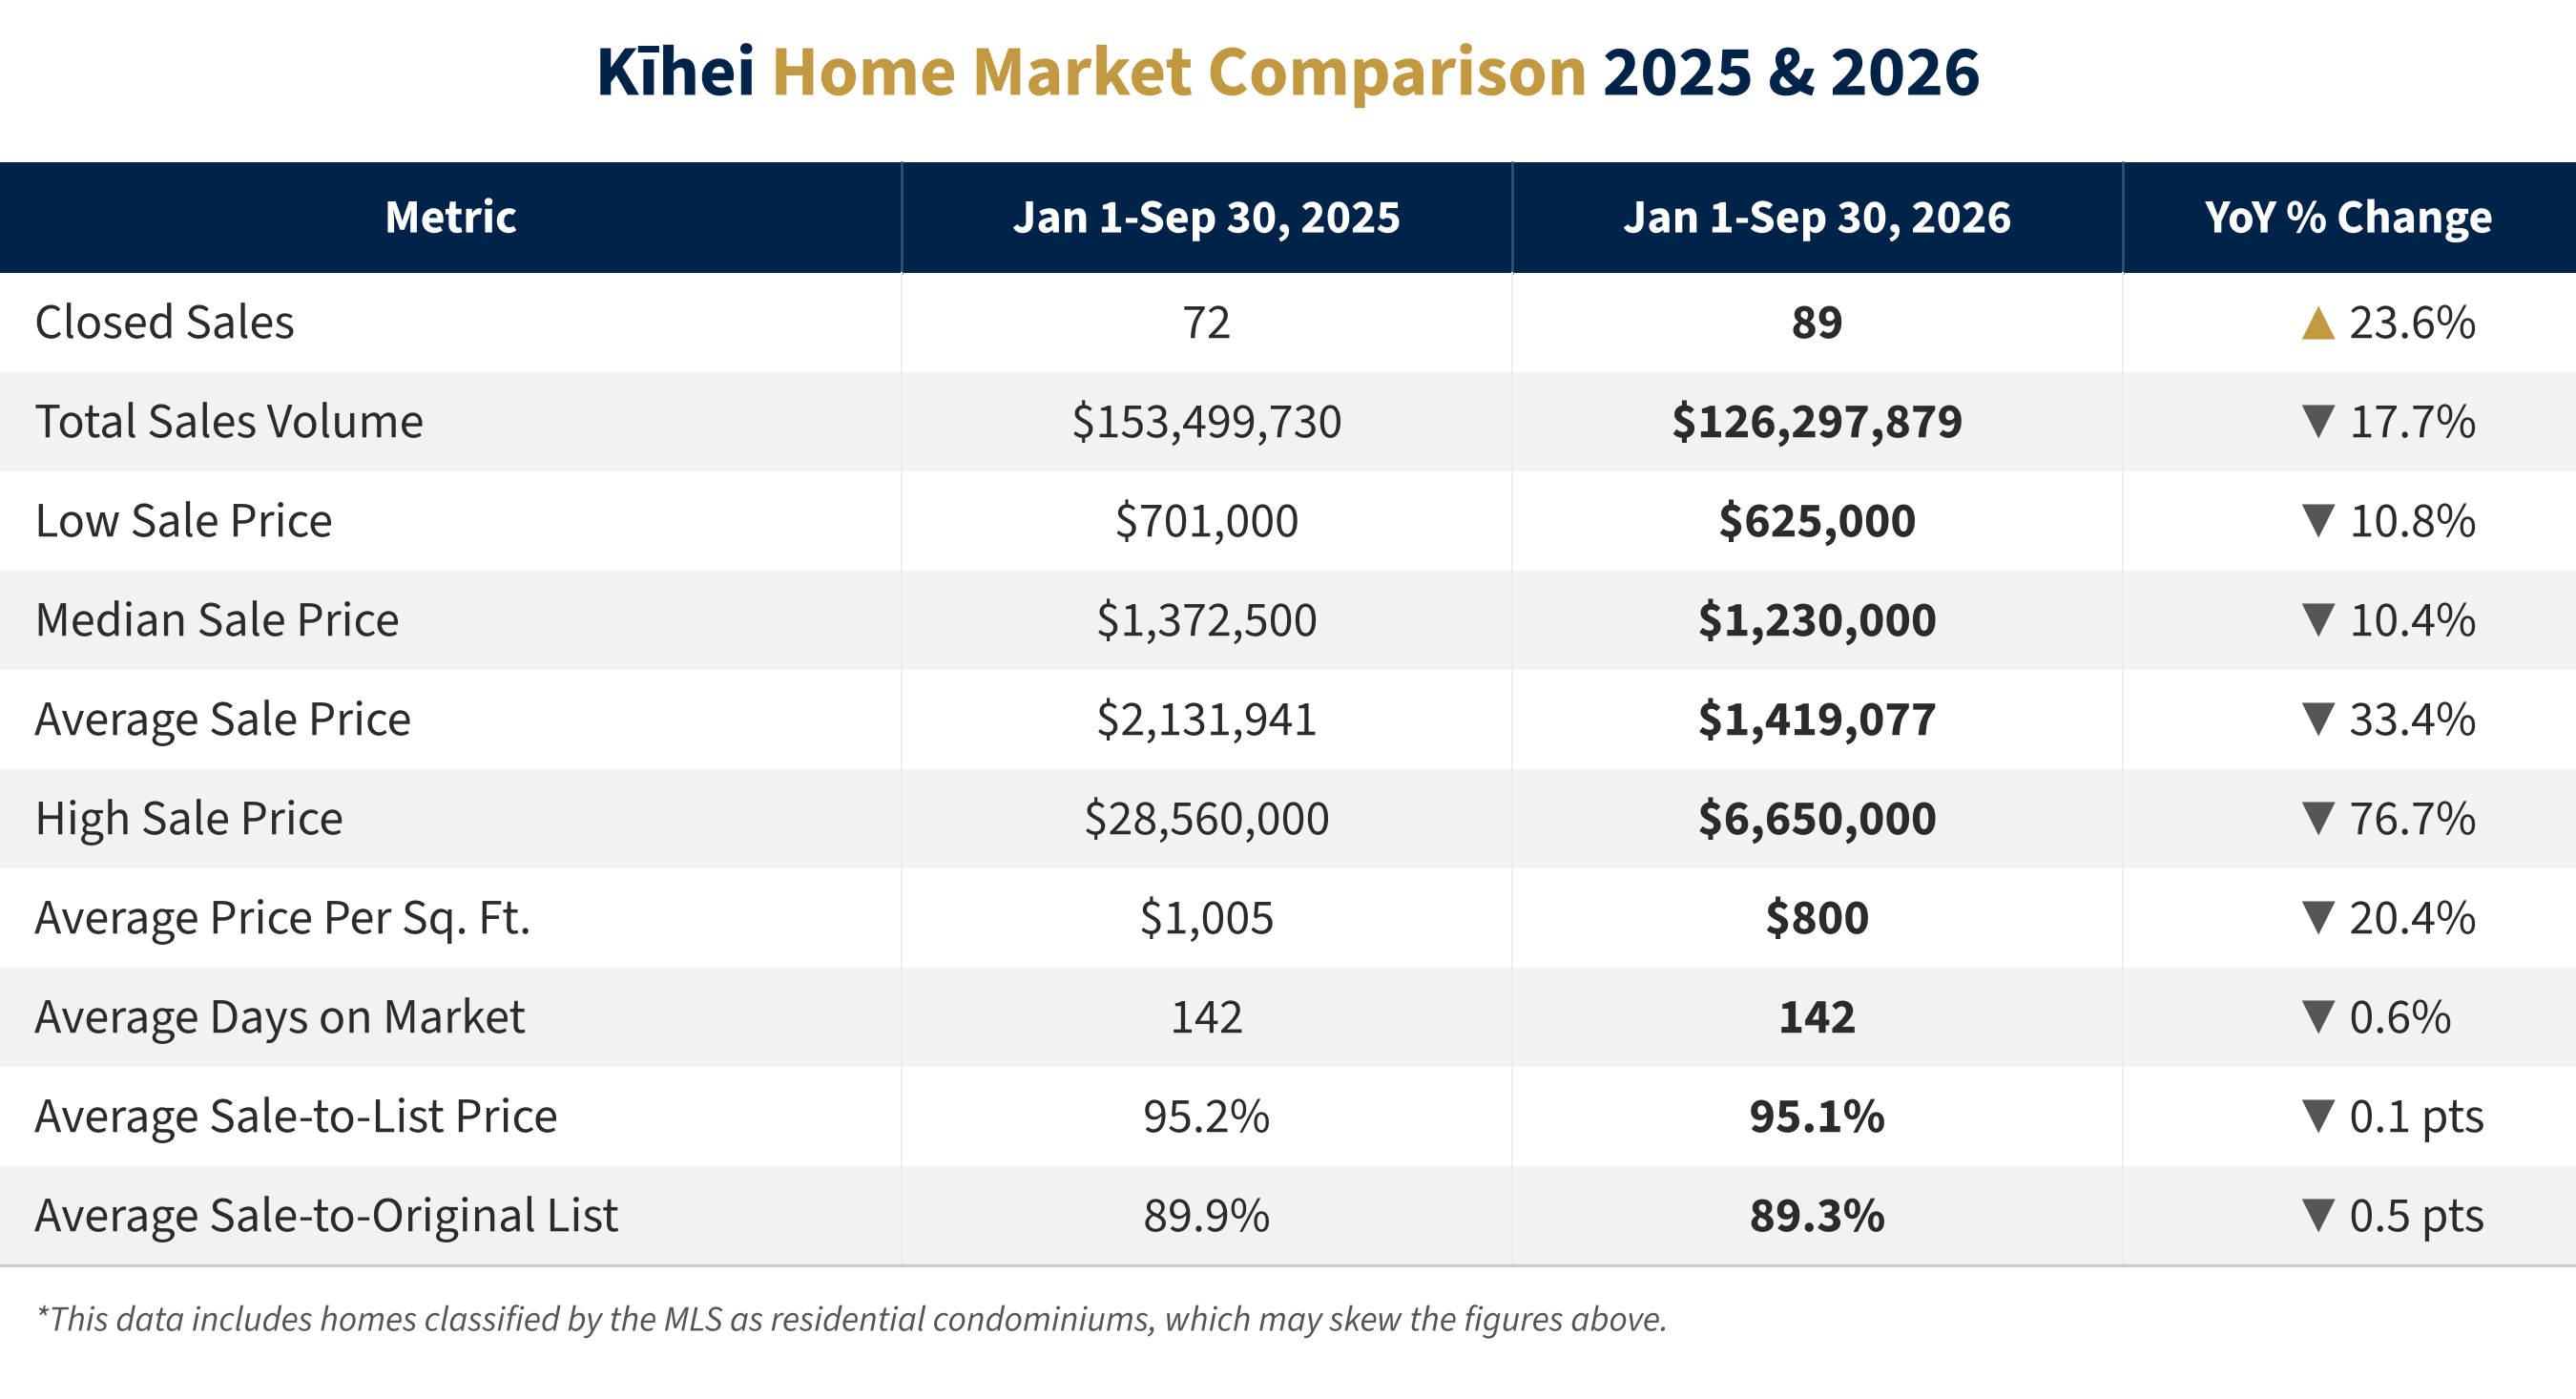
Kīhei was the most active home market in this report, with 89 sales through Q3 2026, up 23.6% from 72. The median sale price moved from $1,372,500 to $1,230,000, and total volume from $153.5 million to $126.3 million. The 2025 period included the $28,560,000 Keawakapu Beach sale and several Halama Street oceanfront homes between $6.0 and $9.9 million; the top 2026 sale was $6,650,000. Sales under $1 million rose from 12 to 20, and the $1–2 million range from 47 to 62.
Kīhei homes continue to sell close to asking, at an average of 95.1% of list price, with average days on market steady at 142. Average price per square foot moved to $800 from $1,005, again reflecting the mix shift toward more accessible homes. For buyers, Kīhei offers the broadest selection of homes under $2 million in South Maui; for sellers, steady demand rewards well-presented, accurately priced listings.
Where Is the Kīhei Home Market Now? What Is the Absorption Rate?
Kīhei has the tightest supply in this report at 5.9 months, with 59 active listings and 12 pending against 119 sales over the past 12 months. 3-bedroom homes (4.5 months), homes under $1 million (3.4 months) and the $1–2 million range (5.3 months) are moving fastest. Supply is deeper among 5-bedroom homes (9.6 months), the $2–3 million range (9.6 months) and homes above $5 million (30.0 months).
Explore Kīhei homes for sale →
Wailea & Mākena Homes
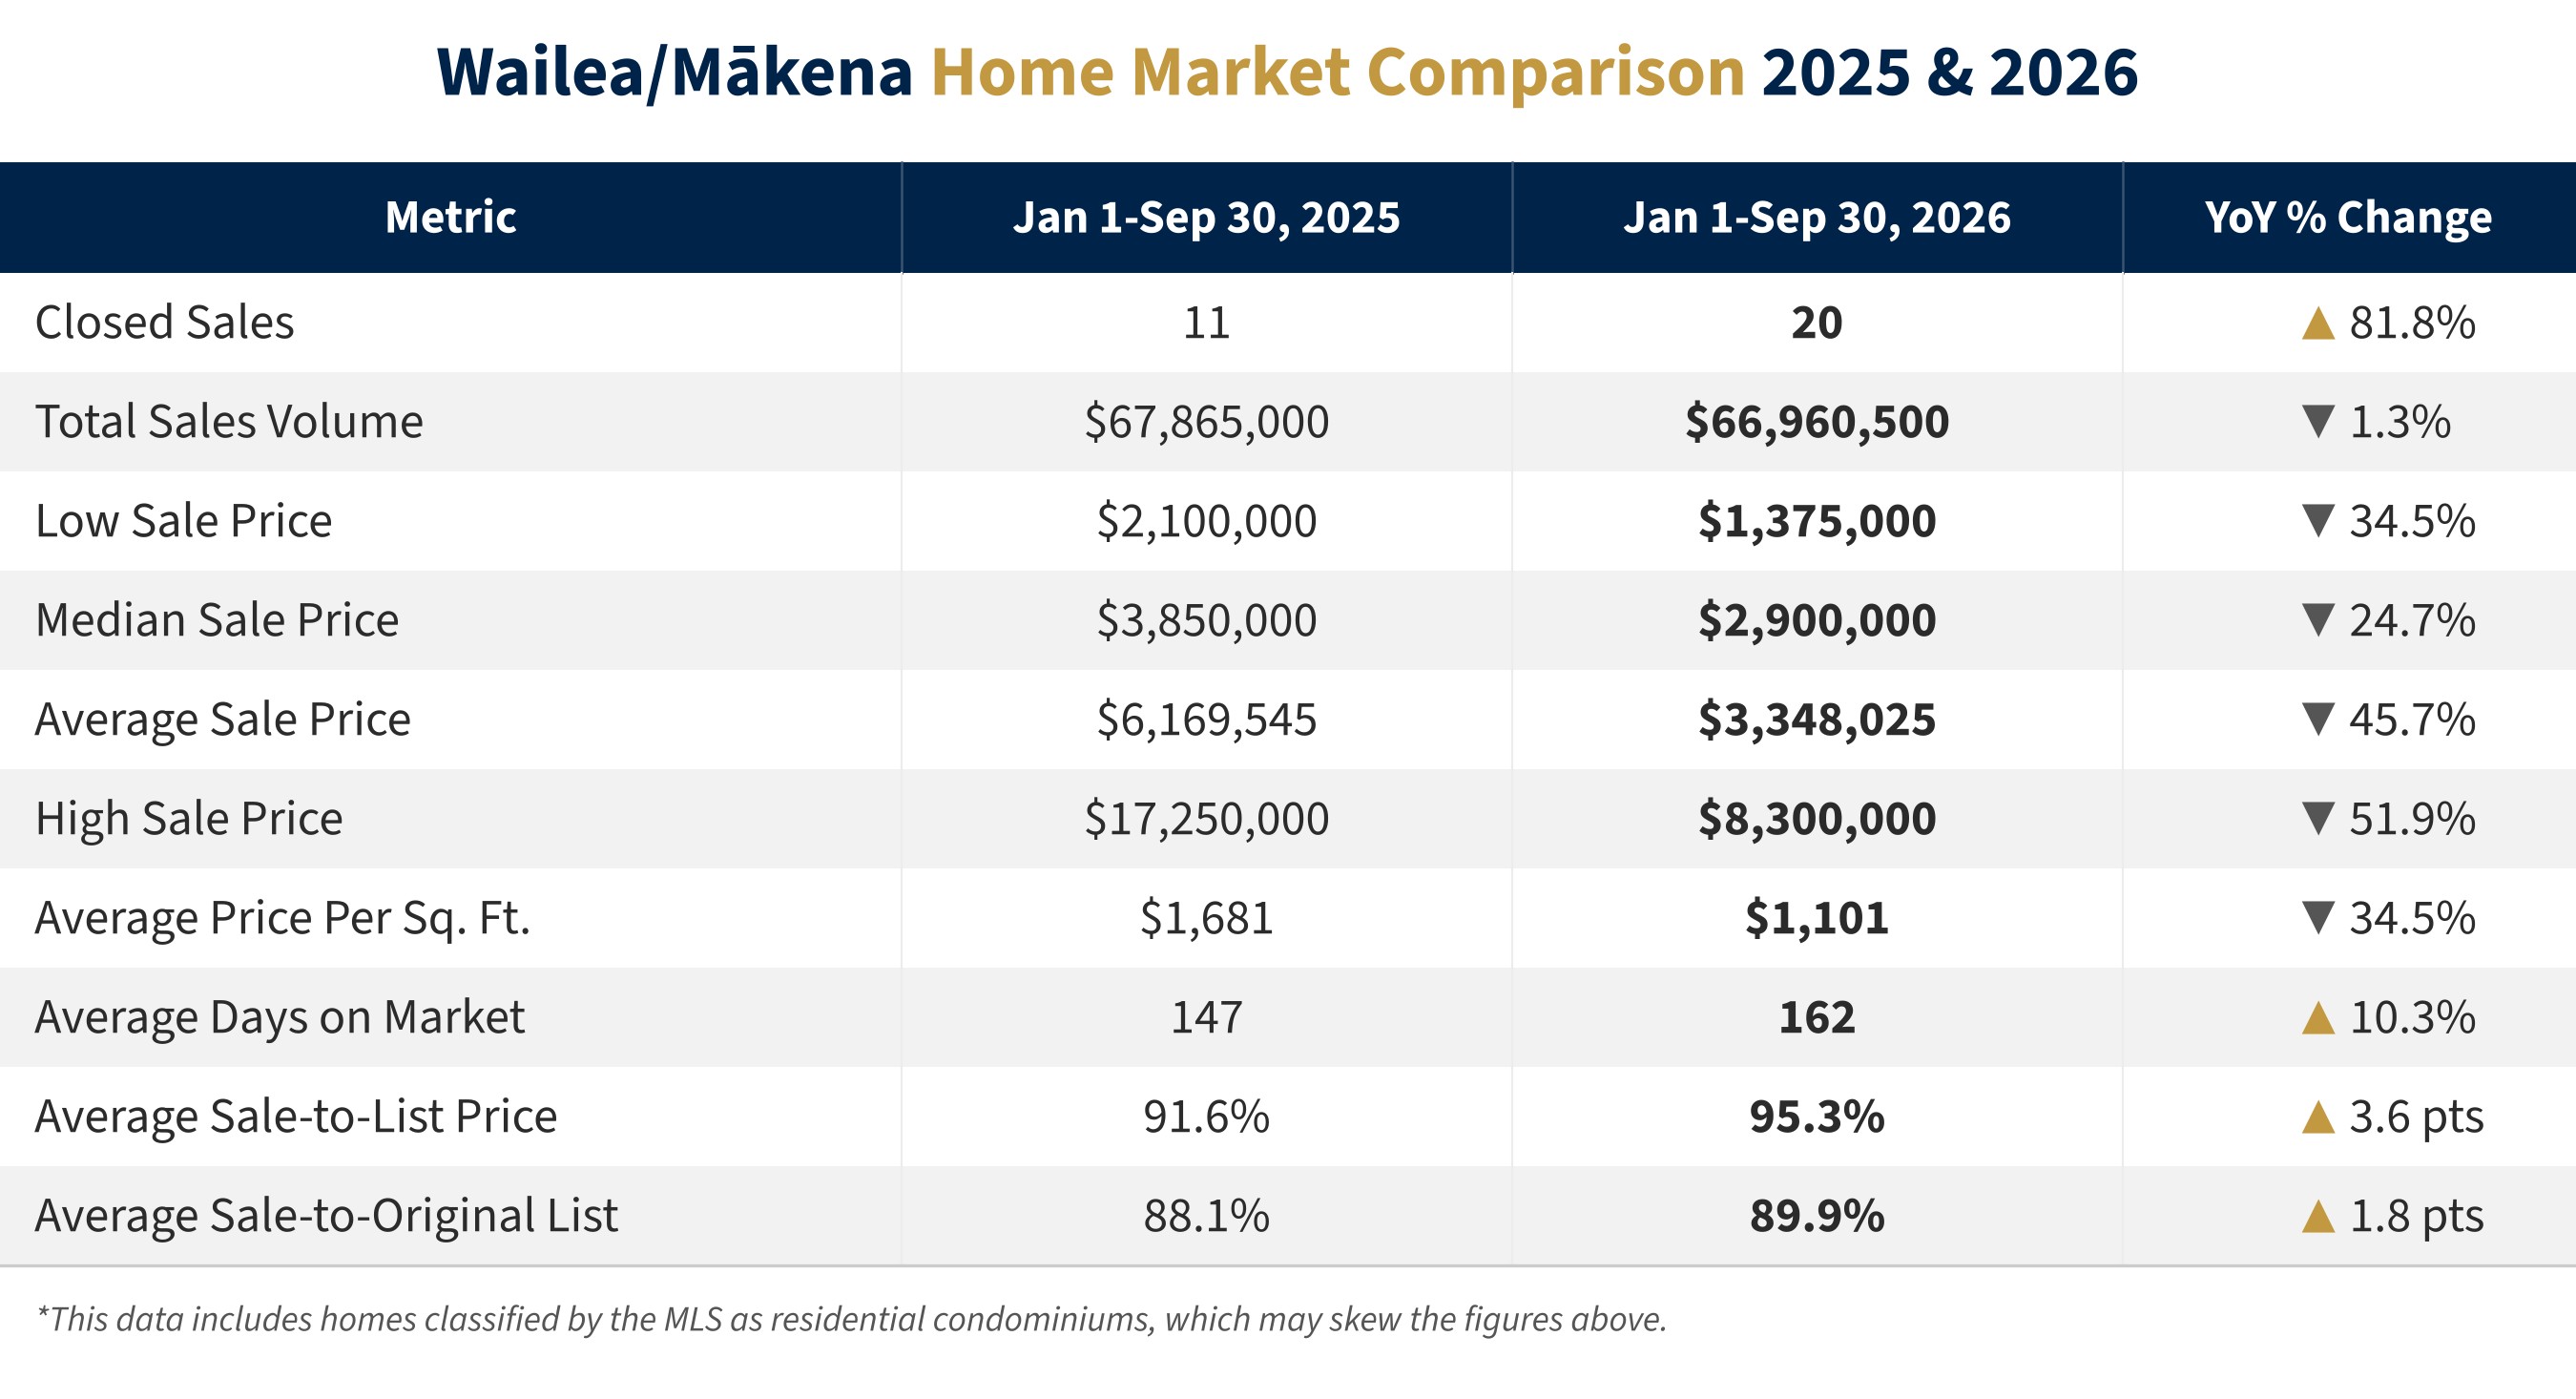
Wailea/Mākena posted the strongest sales growth in this report, with 20 home sales through Q3 2026, up 81.8% from 11. Total volume held essentially even at $67.0 million (down 1.3%), and the median sale price moved from $3,850,000 to $2,900,000. The 2025 period included the $17,250,000 Mākena Road and $14,470,000 One Palauea Bay sales. In 2026, activity centered on Wailea's established neighborhoods, including Wailea Kai, Wailea Kialoa and Wailea Pualani, with top sales at The Ridge at Wailea ($8,300,000 and $5,300,000) and Wailea Golf Estates ($6,600,000). Sales between $2 million and $3 million rose from 3 to 8.
Buyers and sellers are meeting closer to asking: the average sale-to-list ratio improved to 95.3% from 91.6%. Average price per square foot moved to $1,101 from $1,681, reflecting fewer estate-level sales.
Mākena's oceanfront and ocean-view estates had no closings in the 2026 period, but two Mākena Road properties are pending, listed at $9,000,000 and $19,950,000, and 7 active Mākena listings range from $18,900,000 to $45,000,000.
Where Is the Wailea/Mākena Home Market Now? What Is the Absorption Rate?
Wailea/Mākena carries 12.4 months of supply, with 28 active listings and 5 pending against 27 sales over the past 12 months. The $1–2 million range (6.0 months), the $3–4 million range (6.7 months) and 5-bedroom homes (6.0 months) are moving fastest, while 3-bedroom homes sit at 10.3 months. The $5 million-plus segment, which includes the Mākena estates, holds 33.0 months of supply, and 4-bedroom homes 18.0 months.
Wailea/Mākena recorded 11 and 20 home sales in the two periods; individual estate sales can move averages significantly.
Explore Wailea and Mākena homes for sale →
What Does This Mean for Buyers and Sellers?
Across West and South Maui, the 2026 home market reflects a rebalancing rather than a slowdown. Buyers are most active below $3 million, and homes in that range are moving at a steady pace, especially in Kīhei and Kāʻanapali. Above $4 million, including Kapalua Resort, Wailea Golf Estates and the Mākena estates, buyers have a broader selection and more time to evaluate their options.
For sellers, accurate pricing from the start is the strongest strategy. Homes are selling at 94–95% of list price on average in both regions, and the segments with the tightest supply, including Kīhei, Kāʻanapali and homes under $3 million, reward well-presented, well-priced listings.
For buyers, current supply levels in the upper price bands, in Kapalua Resort and in the Wailea/Mākena estate segment offer room to compare properties and negotiate thoughtfully. Launiupoko's rising price per square foot and the tighter inventory in Kīhei and Kāʻanapali show the value of preparation, with financing and clear criteria in place, so you can move with confidence when the right home appears.
Maui Home Market Report: West & South Maui, January to September 2026
Curious What This Means for Your Property or Search?
I would be glad to walk you through the data for your neighborhood, review recent comparable sales, or prepare a custom analysis for your home. Reach out anytime to start the conversation.
By Courtney M. Brown, R(S) 56519 | Island Sotheby’s International Realty | October 8, 2026
Closed-sale data: Realtors Association of Maui MLS, single-family homes, January 1–September 30, 2025, compared with January 1–September 30, 2026; data pulled October 8, 2026. Information deemed reliable but not guaranteed.
South Maui (All) includes Kīhei, Wailea/Mākena, Maui Meadows and Māʻalaea. Absorption rate: active listings as of October 8, 2026, divided by average monthly closed sales over the trailing 12 months. Pending listings are not counted as active.
West Maui (All) includes Kapalua, Nāpili/Kahana/Honokōwai, Kāʻanapali, Lahaina, and Olowalu/Ukumehame. Launiupoko is part of the MLS Lahaina district. Residential condominium–classified homes (including the Vintage, the Summit, and Launiupoko CPR properties) are included. The 2025 West Maui low sale ($650,000) was a leasehold Alaeloa property.
Posted by Courtney M. Brown on
Enjoy this blog post? Click here to subscribe for updates
Leave A Comment